Performance History
The majority of the below reflect measurements on Addict Motorsport Design's (AMD) Mustang Dyno. Those acquainted with AMD know that this is one of the lowest reading dyno's around. I'm very clear on the purpose of using a dyno: it's to measure improvements. I have zero interest in comparing across dyno's and trading internet ego with others across the world based on how big / small the numbers of individuals are. I've seen dyno graphs from stock RS4's reading as high as 400hp at the wheels, and as low as 280. You can configure a dyno in any old way is really the story, comparing across them is an exercise devoid of precision...
* Data pulled from National Weather Service Forecast Office, and specific for Seattle, while dyno is located in Woodinville (about 19 miles North of Seattle). Best approximation to documented Hi/Lo used based on time of dyno run. All relative humidity listed as average recorded that day.
Performance Improvement Details
12.12.2012
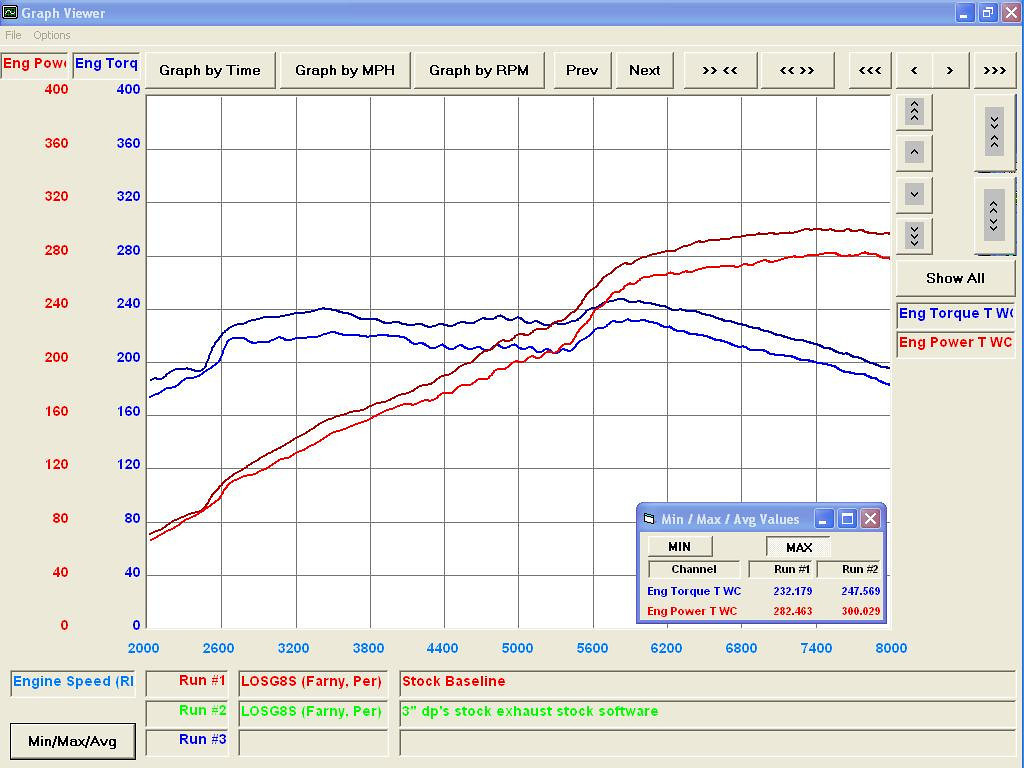
Below you see the first dyno runs my car has done. It compares stock with adding AMD 3" Down Pipes, and removing all cats (click to view higher res version).
3.15.2013
Got the AMD Supercharger installed! Tune not complete yet, but did a run against a friends RS4 with catback and hi-flow cats. Amazingly, it is possible to miss a shift to fourth, as I proved on the second run :) This is when the car was ~390whp on the Mustang dyno vs the 415whp we ended up at (which read as 450whp on the Dynojet).
4.26.2013
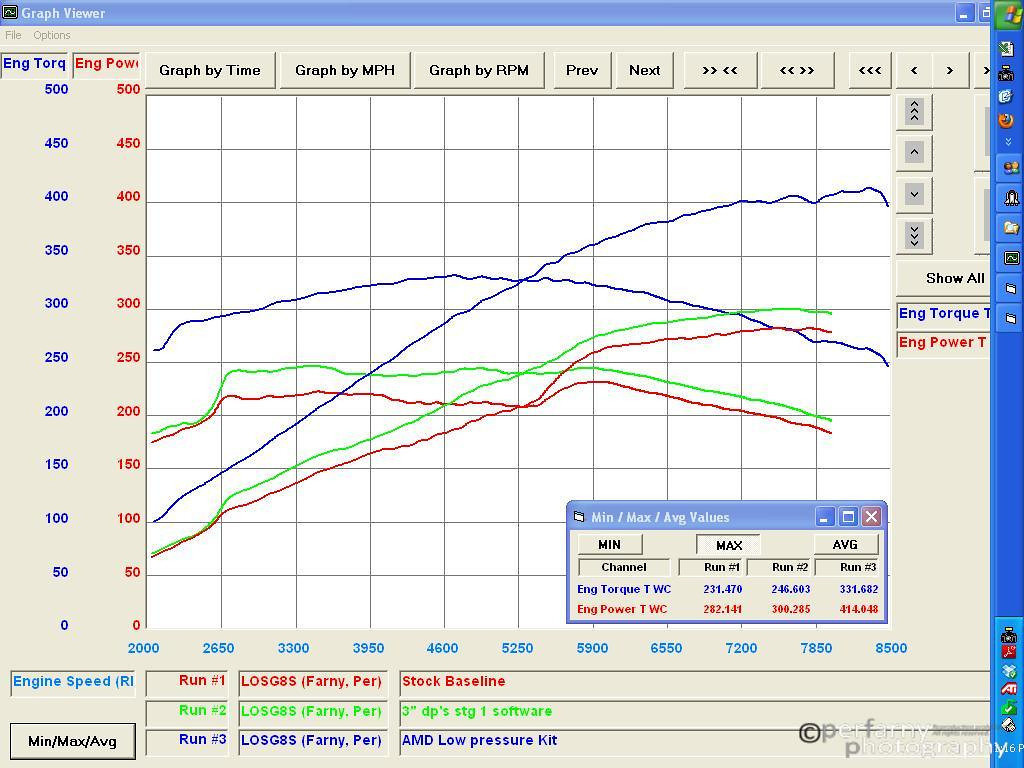
Finally got the AMD Supercharger install finalized. Note new curves added to the chart below.
5.1.2013
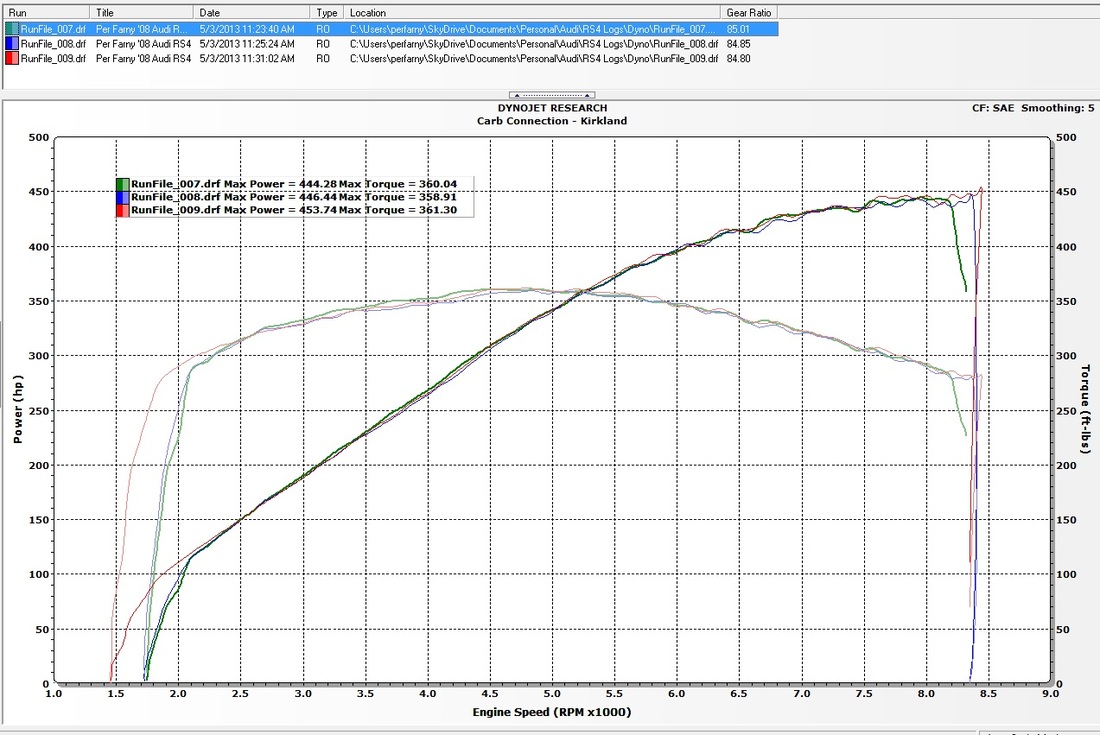
Took the car over to a local Dynojet, to see the differences in results from Mustang to Dynojet.
5.08.2013
Car made it down to the strip and did 11.812 @ 118.72 mph!
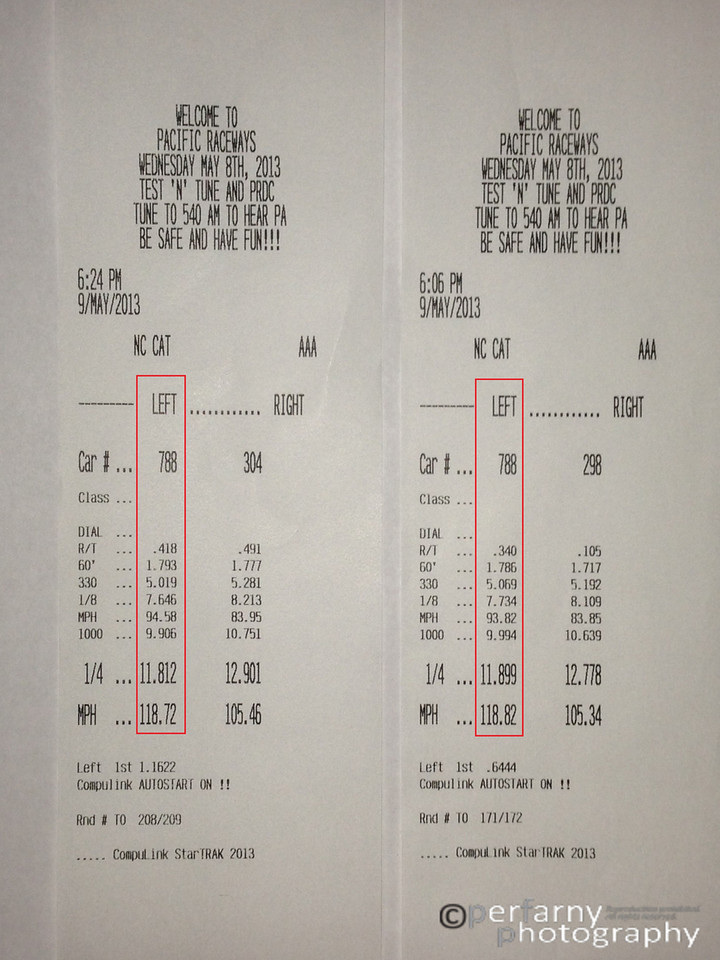
Time slip: 11.812 @ 118.72 mph and 11.89 @ 118.82
|
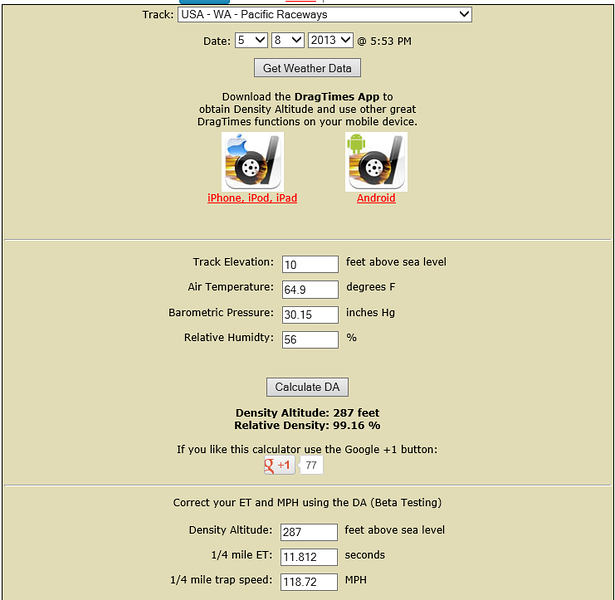
Density Altitude Calculator from dragtimes.com
|
07.13.2013 // Me at the wheel
First time ever I've taken any car down the 1/4 mile track. Was a lot of fun!

